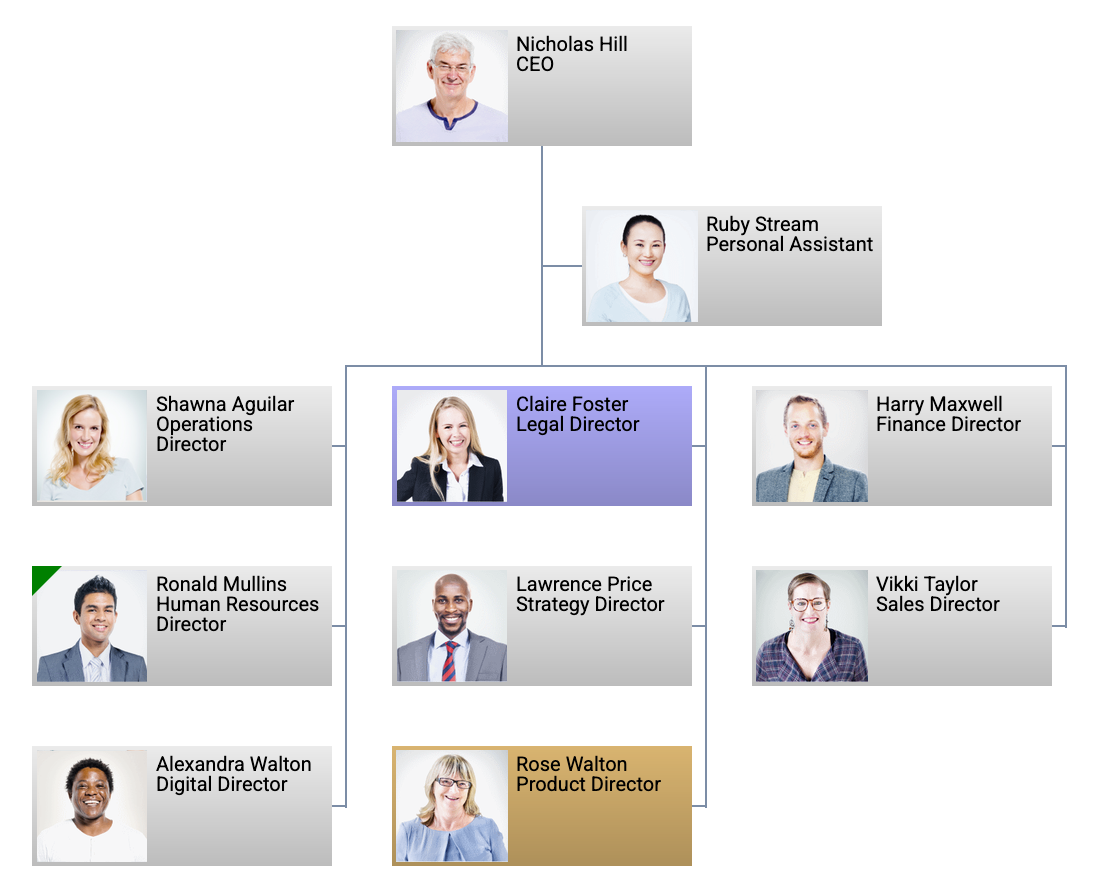
What is an org chart?
An org chart, also called an organization chart, organizational chart or hierarchy chart, is a visual representation of a company's structure.
It shows people, positions, departments and reporting relationships so employees can understand how the business is organized and who is responsible for what.
At its simplest, an org chart answers practical questions: who manages whom, where a team sits in the wider organization, how departments connect and who to contact when a decision or issue needs attention.
For small organizations, everyone may know everyone else, but as a company grows across teams, locations, cultures and time zones, that informal knowledge becomes harder to maintain. A clear organization chart gives employees a shared view of the structure and how teams interact.
Start your free 30-day trial
Explore every TeamOrgChart feature with no commitment and no credit card. Sign in with your Microsoft work or school account to get started.
 Sign in with Microsoft
What information does an org chart display?
People and positions
Names, job titles, departments, locations, profile pictures and contact details can help employees identify and connect with colleagues quickly.
Reporting lines
Manager relationships show how responsibility flows through the organization and where each person fits in the team structure.
Departments and teams
Grouping people by function, region, location or business unit helps employees understand the bigger picture.
Common scenarios
- Onboarding
- Management planning
- Resturcturing
- Internal communication
- Day-to-day collaboration
- Tracking vacancies
Why org charts still matter
Some organizations want to move away from rigid hierarchy, but that does not remove the need for a clear map of roles and responsibilities.
Employees still need to know how teams relate to one another, how decisions are made and where expertise can be found. A successful org chart can adapt to changing roles and dynamic teams.
For example a receptionist helping a caller, a project manager building a cross-functional team and an IT administrator rolling out a new system can all benefit from an accurate view of the organization.
The challenge iss maintaining accuracy. Promotions, new hires, leavers, reorganizations and temporary assignments can make static Powerpoint, Visio or PDF charts out of date quickly.
Static vs dynamic org charts
Many businesses still maintain organization charts by hand in diagramming tools.
This can work for a small, stable team, but it becomes difficult when people move roles, teams change shape or the chart must be distributed to a wider audience.
| Static org chart | Dynamic org chart |
|---|---|
| Built and updated manually | Generated from employee data |
| Time-consuming to rebuild | Adapts when teams change |
| Usually owned by one person or team | Maintained by connected data source |
| Limited to basic employee information | Provide richer employee profiles |
| Shared as a file or image | Published as an interactive resource |
| Hard to personalize for different audiences | Create charts for any situation |
| Quickly becomes out of date | Reflects changes in data source |
| Hard to navigate large organizations | Supports search, filtering and bookmarks |
How can org charts can help your company?
A good org chart is more than a documentation exercise.
It can improve onboarding, collaboration, workforce planning and organization awareness.